1. Introduction:
This post will go through some basic concepts and examples. All the experiments are running on the Ubantu 18.04, TimeScaleDB is a time-series plugin to PostgreSQL, all data storage are delegated to PostgreSQL, It provides index for fast retreiving and storing as well as time-series functions.
![TimeScaleDB[figure 1]](../images/timescale_db_01.png)
Similarly, PostGIS adds extra types (geometry, geography, raster and others) to the PostgreSQL database. It also adds functions and indexes that apply to those types. So, Those can be viewed as plugins to PostgreSQL.
Putting them together in PostgreSQL can create a time-series spatial databases. The Architecture can be in figure 2.
2. TimeScaleDB
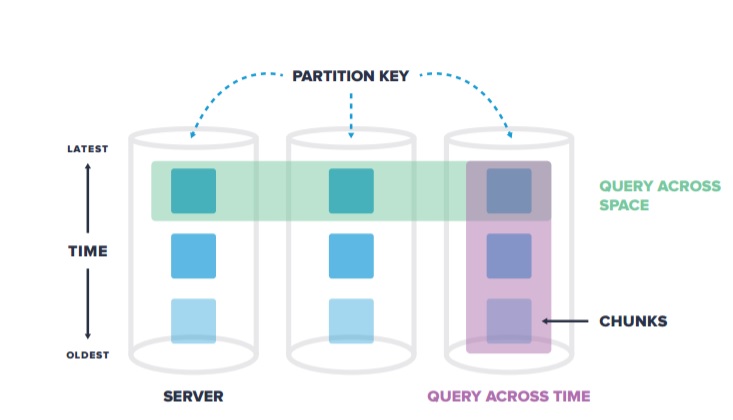
In TimeScaleDB, data are automatically split into trunks by time vertically and space horizontally.
I will go over some key Concepts in the documents, If you want to know more about the Architecture of TimeScaleDB and its differences to other dbs, please refer to their document
2.1 Hypertable
The Hypertables are a combination of many individual tables holding the data. A hypertable is the abstraction of a single continuous table across all space and time intervals. A hypertable is defined by a standard schema with column names and types, with at least one column specifying a time value, and one (optional) column specifying an additional partitioning key. Indexes on time and partitioning key will be automatically created on hypertable.
2.2 Chunk
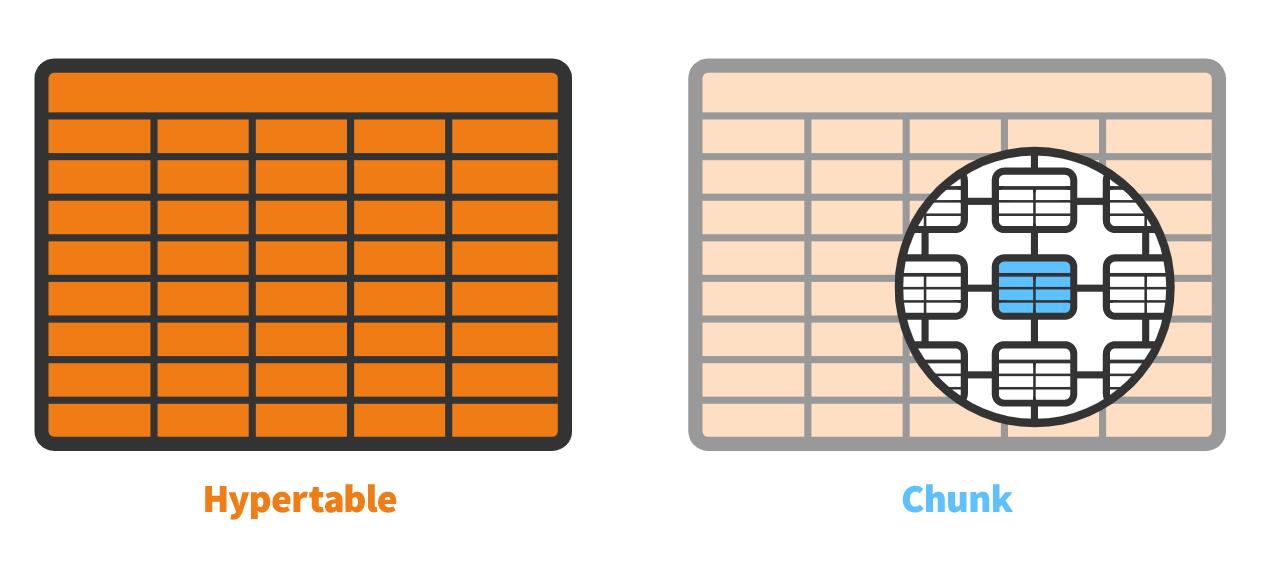
Each Hypertable is consist of many chunks, where every single chunk is actaully standard database table. Each chunk is corresponding to a specific time interval and a set of the partition key’s space. There is no overlapping between each chunks.
This shows the relationships between Hypertables and chunks.
3. Installation
I installed postgreSQL and TimeScaleDB via apt.
3.1 Install ProgreSQL 11.0
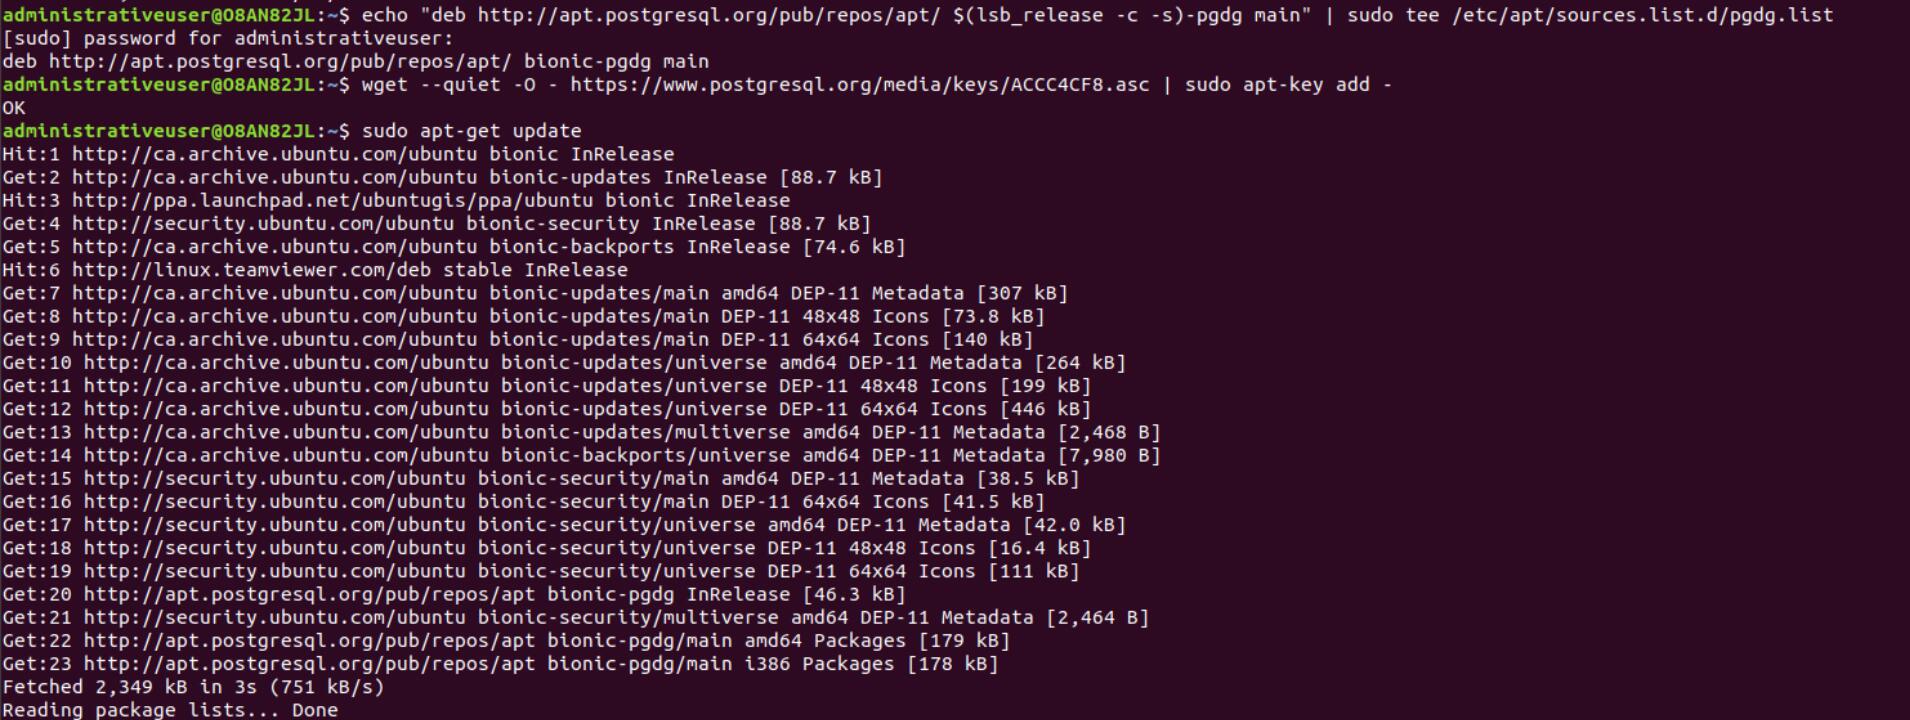
If you don’t have postgreSQL installed, add PostgreSQL’s third party repository to get the latest PostgreSQL packages.
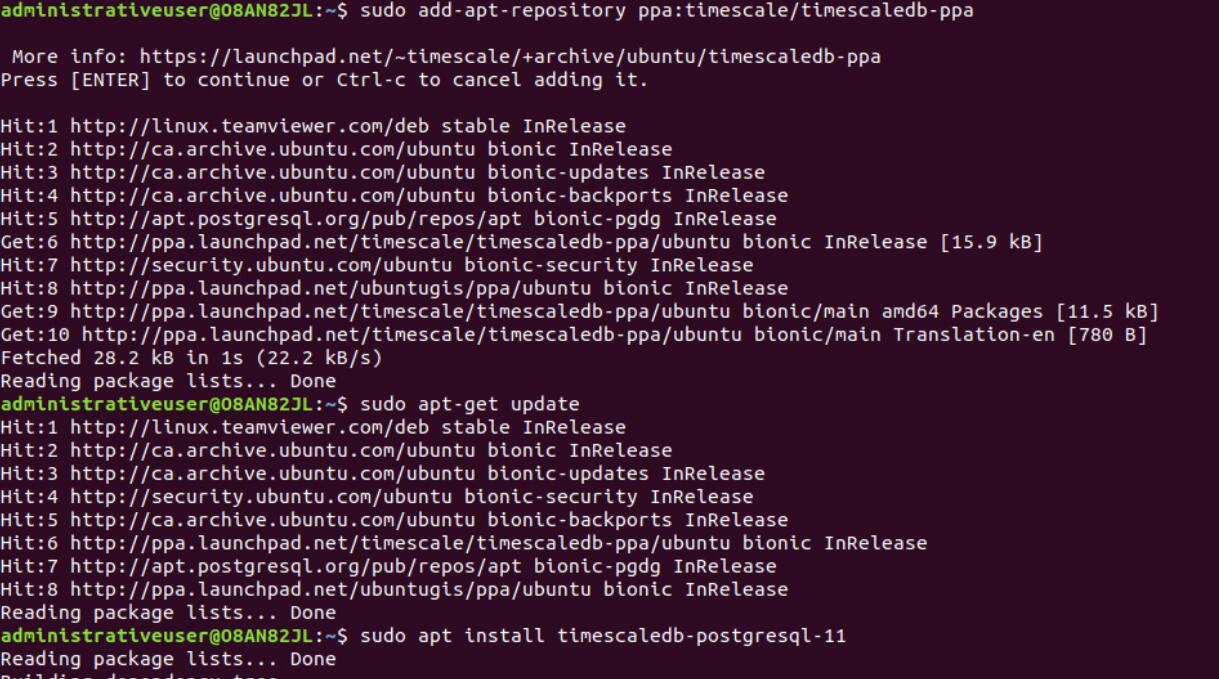
Then, adding TimescaleDB’s third party repository and install TimescaleDB, which will download any dependencies it needs from the PostgreSQL repo.
The scripts are as follows:
echo "deb http://apt.postgresql.org/pub/repos/apt/ $(lsb_release -c -s)-pgdg main" | sudo tee /etc/apt/sources.list.d/pgdg.list
wget --quiet -O - https://www.postgresql.org/media/keys/ACCC4CF8.asc | sudo apt-key add -
sudo apt-get update
# Add TimeScaleDB PPA
sudo add-apt-repository ppa:timescale/timescaledb-ppa
sudo apt-get update
# Now install appropriate package for PG version
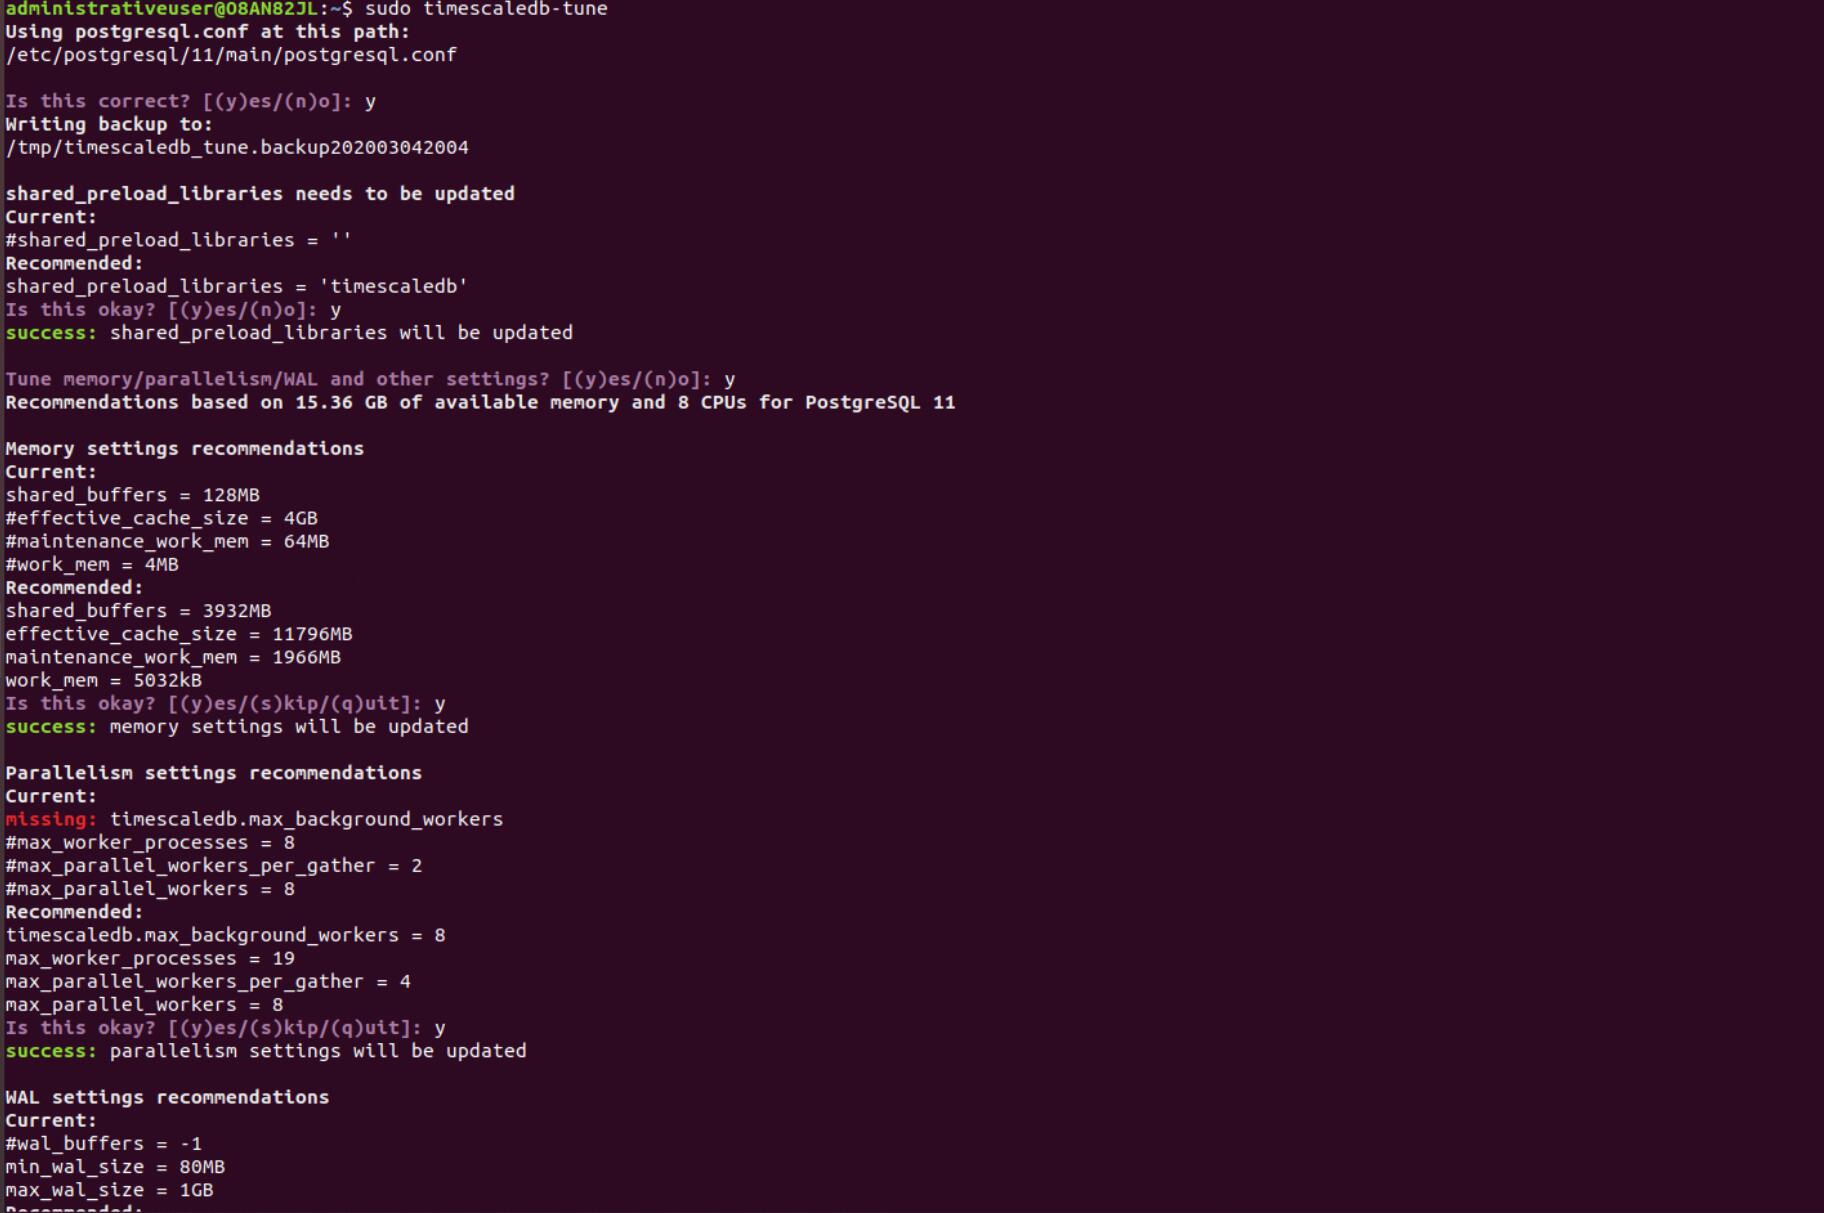
sudo apt install timescaledb-postgresql-11After installing TimeScaleDB on your single machine, it is recommended to tune the db with the script.sudo timescaledb-tune
3.2 Connect to PostgreSQL/TimeScaleDB and Setup Password
Let us connect to the database and create a database called tutorial to make sure PostgreSQL and TimeScaleDB is installed.
Connecting to the server by psgl tool, the super user postgres has no DB password set on Ubuntu OS by default.

You could set up your own password on your db.
ALTER USER postgres PASSWORD 'yourPassWord';After that you could use the command
# Connect to PostgreSQL, using a superuser named 'postgres'
psql -U postgres -h localhost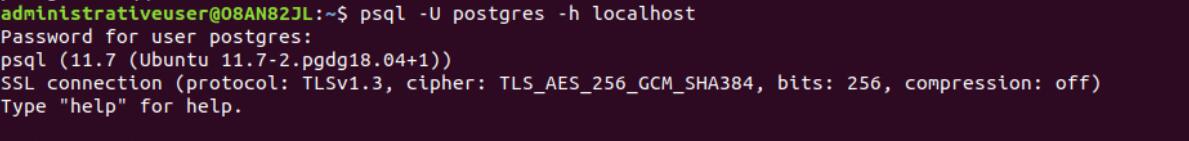
Now, we can connect to the database we have, and add TimeScaleDB plugin to it.
-- Connect to the database
\c tutorial

-- Extend the database with TimescaleDB
CREATE EXTENSION IF NOT EXISTS timescaledb CASCADE;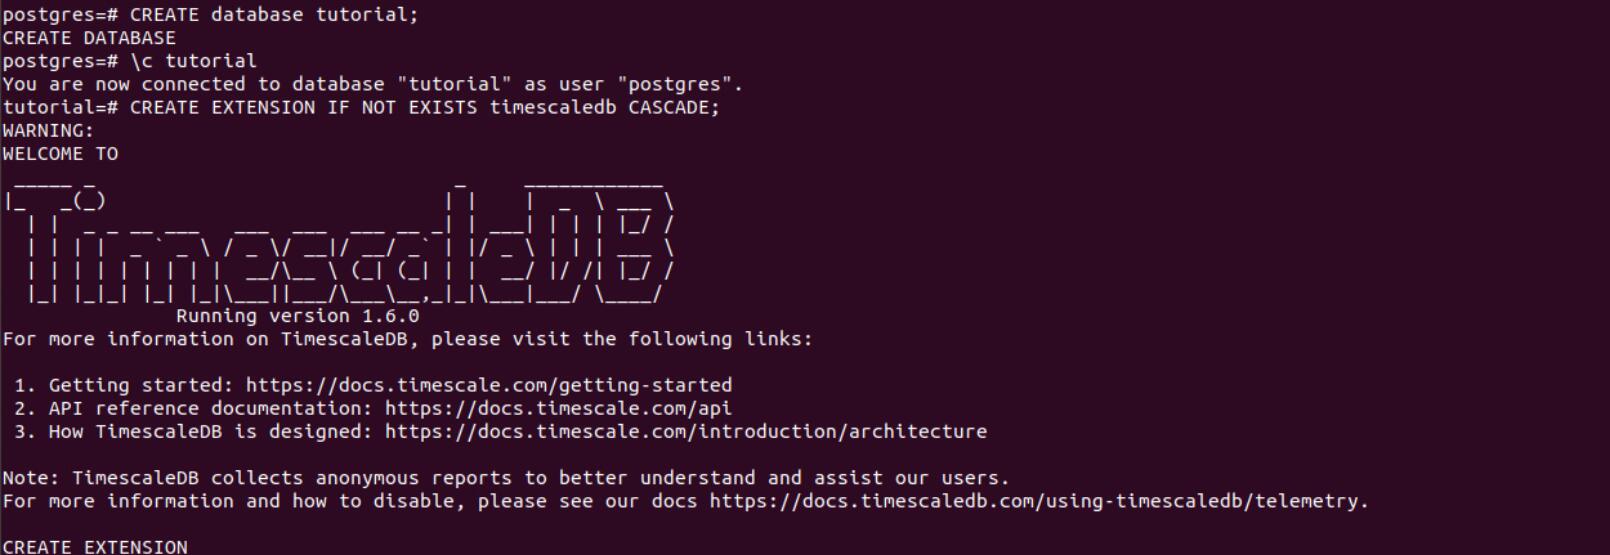
3.3 PostGIS Installation
We could install PostGIS with apt.
sudo apt update
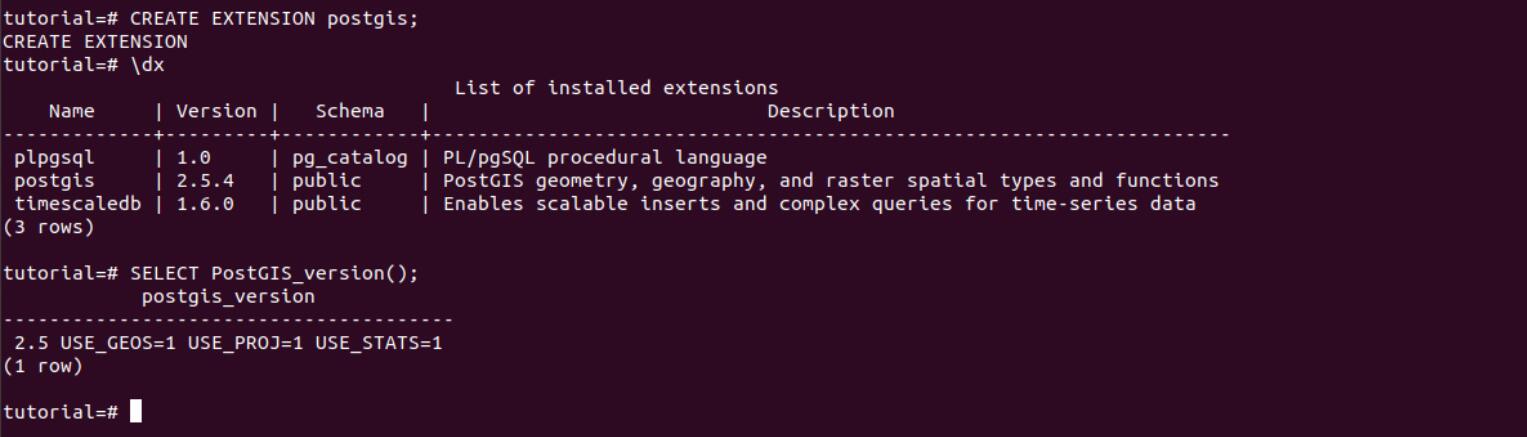
sudo apt install postgis postgresql-11-postgis-2.5After installation, go to the tutorial database we have setted up and create postgis extesion on this db.
The result is shown in figure 10.
4. Go through the NYC taxicab data in offical Document.
In the offical tutorial, they use Cloud version of TimscaleDB, it is similar to community version in this example.
Get and extract the dataset
wget -O - https://timescaledata.blob.core.windows.net/datasets/nyc_data.tar.gz | tar xzIt contains three files:
- nyc_data_contagg.sql: A SQL file for table schemes
- nyc_data_rides.csv: CSV file contains the ride dataset.
4.1 Create the Database.
# create the database called nyc_data
CREATE DATABASE nyc_data;
# connected to the nyc_data base.
\c nyc_data
# Use TimeScale extension
CREATE EXTENSION IF NOT EXISTS timescaledb CASCADE;
4.2 Define scheme and Prepare the data
The dataset comes from New York City Taxi and Limousine Commission (NYC TLC). NYC TLC collects ride-specific data from every vehicle in its fleet, generating data from millions of rides every day. They connect rides data in the following way:
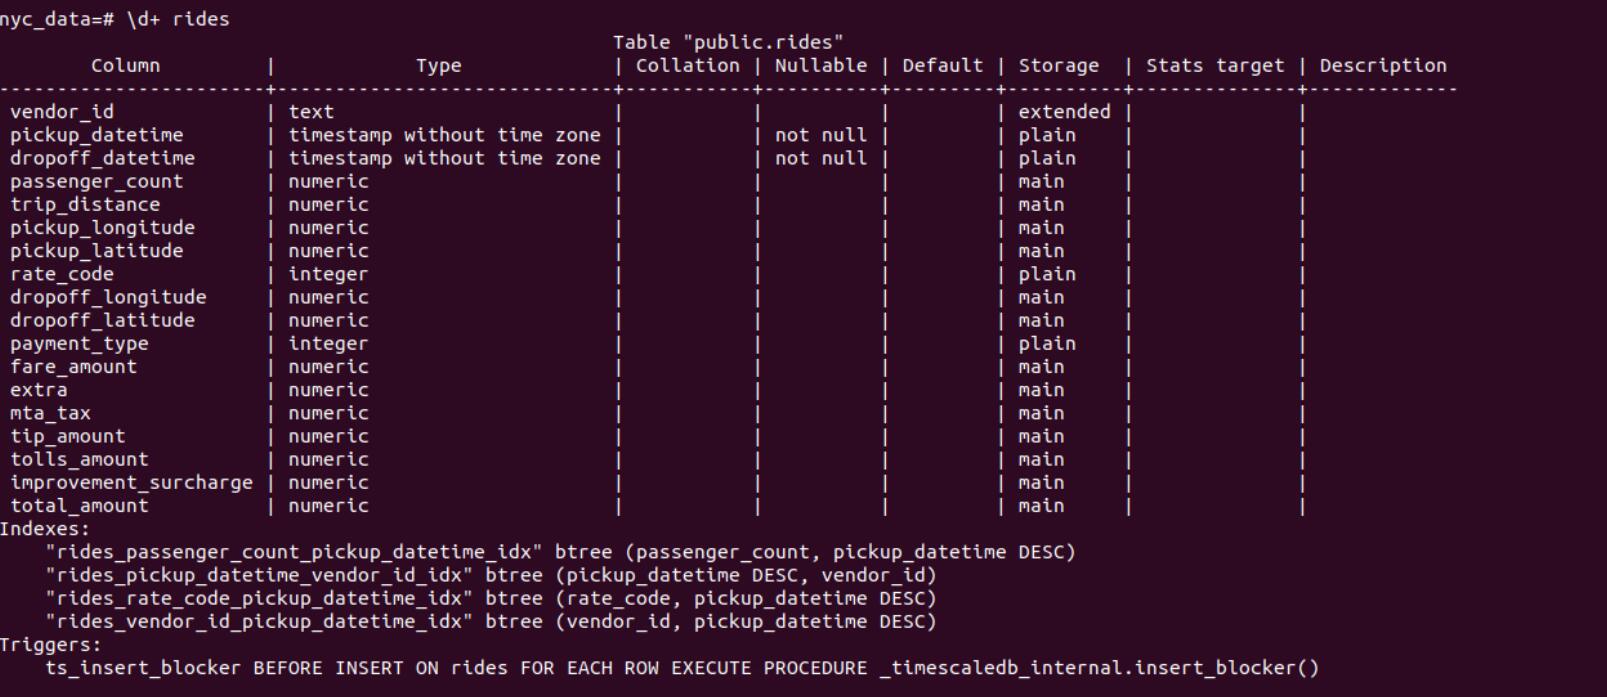
CREATE TABLE "rides"(
    vendor_id TEXT,
    pickup_datetime TIMESTAMP WITHOUT TIME ZONE NOT NULL,
    dropoff_datetime TIMESTAMP WITHOUT TIME ZONE NOT NULL,
    passenger_count NUMERIC,
    trip_distance NUMERIC,
    pickup_longitude  NUMERIC,
    pickup_latitude   NUMERIC,
    rate_code         INTEGER,
    dropoff_longitude NUMERIC,
    dropoff_latitude  NUMERIC,
    payment_type INTEGER,
    fare_amount NUMERIC,
    extra NUMERIC,
    mta_tax NUMERIC,
    tip_amount NUMERIC,
    tolls_amount NUMERIC,
    improvement_surcharge NUMERIC,
    total_amount NUMERIC
);
explanation
- Pickup date and time (as a timestamp)
- Pickup location (latitude and longitude)
- Drop off date and time (as a timestamp)
- Drop off location (latitude and longitude)
- Trip distance (in miles)
- Fares (in USD)
- Passenger count
- Rate type (e.g, standard, airport, etc.)
- Payment type (Cash, credit card, etc.)
Convert to hypertable
SELECT create_hypertable('rides', 'pickup_datetime', 'payment_type', 2, create_default_indexes=>FALSE);
CREATE INDEX ON rides (vendor_id, pickup_datetime desc);
CREATE INDEX ON rides (pickup_datetime desc, vendor_id);
CREATE INDEX ON rides (rate_code, pickup_datetime DESC);
CREATE INDEX ON rides (passenger_count, pickup_datetime desc);
This means that converting rides table conditions to hypertable with time partitioning on pickup_datetime and space partitioning (2 partitions) on payment_type (using hashing), not creating default indexes on time&partitioning columns.
For details of how to create the hypertable, please refer to the documentation here
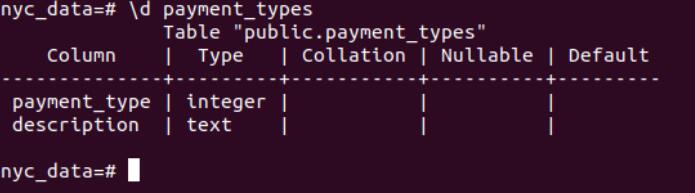
This script create the payments_type table and defines all acceptable payment_types.
CREATE TABLE IF NOT EXISTS "payment_types"(
    payment_type INTEGER,
    description TEXT
);
INSERT INTO payment_types(payment_type, description) VALUES
(1, 'credit card'),
(2, 'cash'),
(3, 'no charge'),
(4, 'dispute'),
(5, 'unknown'),
(6, 'voided trip');
Similarly, rates code.
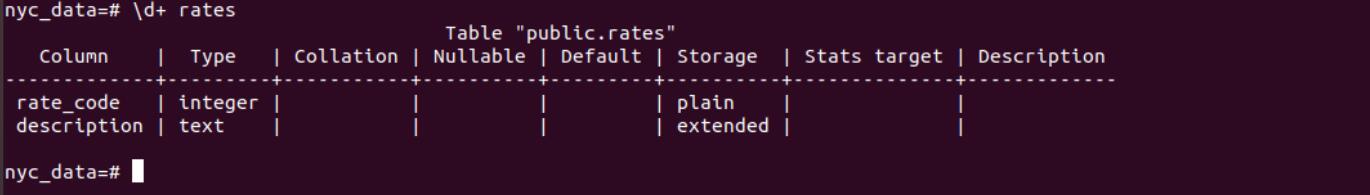
CREATE TABLE IF NOT EXISTS "rates"(
    rate_code   INTEGER,
    description TEXT
);
INSERT INTO rates(rate_code, description) VALUES
(1, 'standard rate'),
(2, 'JFK'),
(3, 'Newark'),
(4, 'Nassau or Westchester'),
(5, 'negotiated fare'),
(6, 'group ride');
Use the following command to import schemes to the database.
psql -U postgres -d nyc_data -h localhost < nyc_data.sqlAfter that We could look at the structure of tables
- rides
- rates
- payment_types
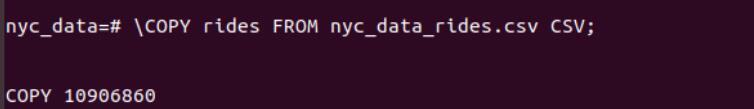
4.2 Import the data and perform the query.
- Loading the data in the csv file to the database.
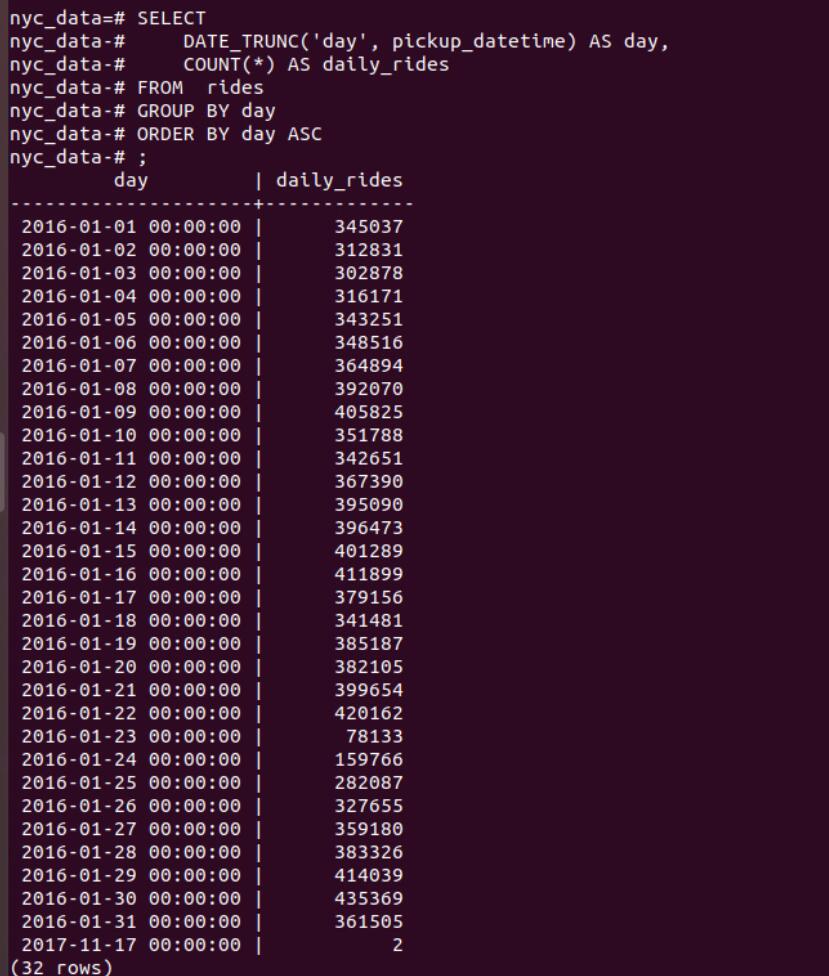
4.2.1 Simple Query task: How many rides took place on each day?
Since PostgreSQL fully support traditional SQL, all required is to run a simple sql to count the number of rides group by pick_up_date and order by it.
The sql scripts is as follows:
SELECT
    DATE_TRUNC('day', pickup_datetime) AS day,
    COUNT(*) AS daily_rides
FROM  rides
GROUP BY day
ORDER BY day ASC
The result is shown in figure 15.
4.2.2 Simple Query task 2: How many rides took place on each day?
What’s the average individual passenger travelling fare before 2016-01-08.
SELECT
    date_trunc('day', pickup_datetime)
    AS day, avg(fare_amount)
FROM rides
WHERE passenger_count = 1
AND pickup_datetime < '2016-01-08'
GROUP BY day
ORDER BY day;
We can see how the sql script executed by adding EXPLAIN keyword.
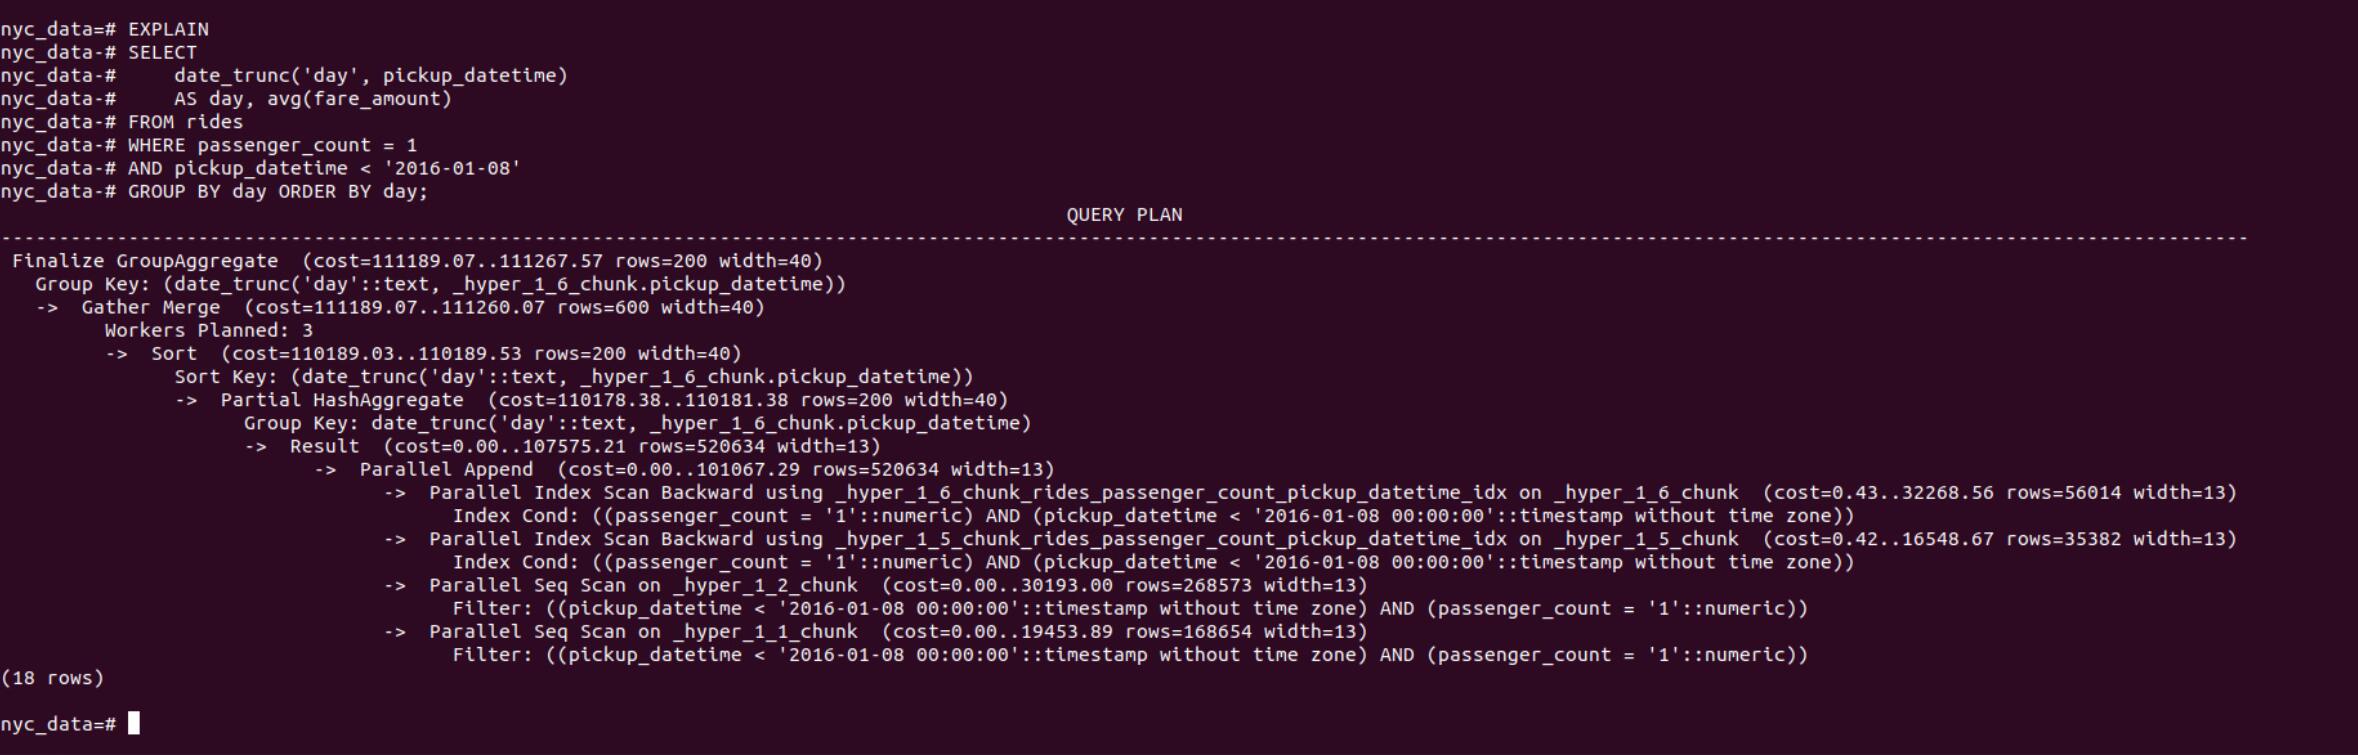
From the result shown in Figure 16, we can see that it first parellelly scan chunks partationed by time range with filter on passenger count and datetime. Then, Group by day and sorting/aggregating the result.
4.2.3 Simple Query Task 3: How many rides took place for each type of rides in Jan, 2016 ?
- sql
SELECT
    rates.description,
    COUNT(rides.vendor_id) AS num_trips
FROM rides
JOIN rates ON rides.rate_code = rates.rate_code
WHERE pickup_datetime < '2016-02-01'
GROUP BY rates.description
ORDER BY rates.description;- query result
SELECT
    rates.description,
    COUNT(rides.vendor_id) AS num_trips
FROM rides
JOIN rates ON rides.rate_code = rates.rate_code
WHERE pickup_datetime < '2016-02-01'
GROUP BY rates.description
ORDER BY rates.description;
4.2.4 Time-series Specail Query Task : How many rides took place every 5 minutes for the first day of 2016?
In vanalia PostgreSQL, What we only have is the DATE_TRUNC function, however if we want to measure the data on arbitary time-interval, time_bucket defined in PostgreSQL allows for arbitary interval , rather than standard minute, hour, day…
SELECT
    time_bucket('5 minute', pickup_datetime) AS five_min,
    count(vendor_id)
FROM rides
WHERE pickup_datetime < '2016-01-02 00:00'
GROUP BY five_min
ORDER BY five_min
LIMIT 12;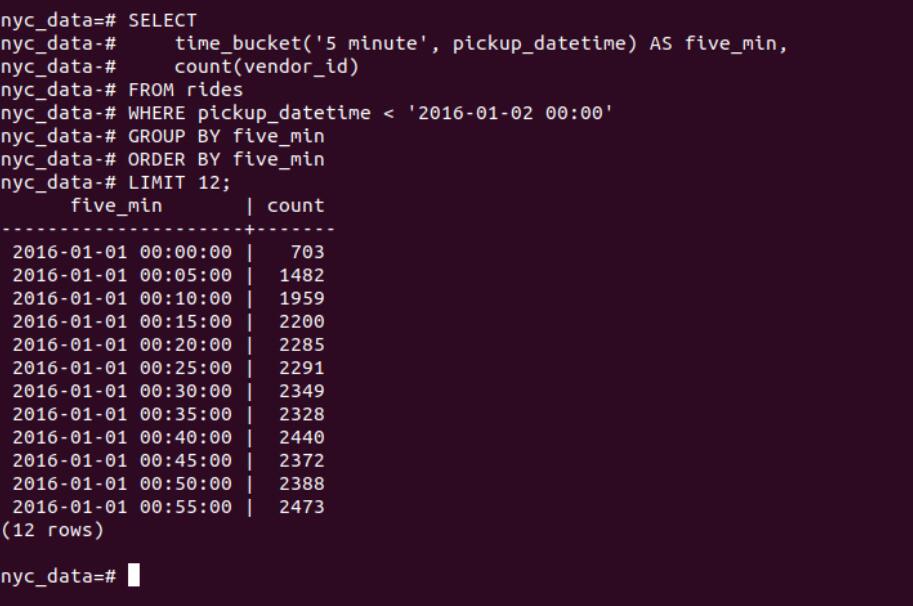
4.2.5 Time-series spatial Query Task: How many rides on New Year’s morning originated from within 400m of Times Square, in 30 minute buckets?
This requires that we make use of the pickup latitude and longitude columns in our rides hypertable. To use the pickup location, we will need to get our hypertable ready for geospatial queries.
We could use the PostGIS, projecting lontitude and latitude with US National Atlas Equal Area - EPSG:2163 standard. More Information
The sql script is as follows:
CREATE EXTENSION postgis;
-- Create geometry columns for each of our (lat,long) points
ALTER TABLE rides ADD COLUMN pickup_geom geometry(POINT,2163);
ALTER TABLE rides ADD COLUMN dropoff_geom geometry(POINT,2163);- Convert the latitude and longitude points into geometry coordinates (units in meters)
UPDATE rides SET pickup_geom = ST_Transform(ST_SetSRID(ST_MakePoint(pickup_longitude,pickup_latitude),4326),2163);
UPDATE rides SET dropoff_geom = ST_Transform(ST_SetSRID(ST_MakePoint(dropoff_longitude,dropoff_latitude),4326),2163);
Times Square is located at (lat, lon) (40.7589,-73.9851).
Up till now, we have all the information to perform the query: How many rides on New Year’s morning originated from within 400m of Times Square, in 30 minute buckets?
SELECT
    time_bucket('30 minutes', pickup_datetime) AS thirty_min,
    COUNT(*) AS near_times_sq
FROM rides
WHERE
    ST_Distance(pickup_geom, ST_Transform(ST_SetSRID(ST_MakePoint(-73.9851,40.7589),4326),2163)) < 400
AND
    pickup_datetime < '2016-01-01 13:00'
GROUP BY thirty_min
ORDER BY thirty_min;